

library(shiny)
library(shinyWidgets)
library(rgl)

make_elliptic_generating_shape <- function(D,S,res=100){
  #Let's define the original ray as 1
  a <- 1
  rc <- (D+1)*a/(1-D)
  t<-seq(0,2*pi,by=pi/res)
  b <- a/S
  circle_0 <- cbind(r=rc + a*cos(t), y= b*sin(t), phi=0)
  return(circle_0)
}

#Function to coil the shape around the axis
coiling <- function(RT,W,generating_shape, turns,steps,dir="dextral"){
  PHI <- seq(0,2*pi*turns,length=steps)
  far_end <- generating_shape[1,1]
  closest_end <- approx(generating_shape[generating_shape[,1]<far_end-1,2],
                        generating_shape[generating_shape[,1]<far_end-1,1],0)$y
  D <- closest_end/far_end
  rc <- (D+1)/(1-D)
  rho <- function(theta, W, r0) r0 * W^(theta/(2*pi))
  y <- function(y0,W,theta,rc,T) y0 * W^(theta/(2*pi)) + rc*T*(W^(theta/(2*pi))-1)
  circle <- apply(generating_shape,1,
                  function(x)lapply(PHI,
                                    function(theta)cbind(r=rho(theta, W, x['r']),
                                                         y=y(x['y'],W,theta, rc,RT),
                                                         phi=theta)))
  circle <- do.call(rbind,lapply(circle,function(x)do.call(rbind,x)))

  #To cartesian coordinates
  if(dir=="dextral"){
    XYZ <- list(X = circle[,1] * sin(circle[,3]),
                Y = circle[,1] * cos(circle[,3]),
                Z = circle[,2])
  }else{
    XYZ <- list(X = circle[,1] * cos(circle[,3]),
                Y = circle[,1] * sin(circle[,3]),
                Z = circle[,2])
  }
  XYZ
}

#Function to create the indices of the vertices of the mesh
pt2quad <- function(steps,res){
  pt_n<- rep(1:(res*2+1),each=steps)
  step <- 1:steps
  eg <- expand.grid(1:(2*res),1:(steps-1))
  apply(eg,1,function(x)c(which(step==x[2] & pt_n==x[1]),
                          which(step==x[2]+1 & pt_n==x[1]),
                          which(step==x[2]+1 & pt_n==x[1]+1),
                          which(step==x[2] & pt_n==x[1]+1)))
}
OK that first part is the one I showed last time, with an additional function pt2quad which takes a dataframe of points (as XYZ coordinates) and return a dataframe of quadrilaterals that will define the 3D shape.
JS.logify <-"function logifySlider (sliderId) {
    // regular number style
    $('#'+sliderId).data('ionRangeSlider').update({
      'prettify': function (num) { return (Math.pow(10, num).toFixed(2)); }
    })
}"
JS.onload <-"$(document).ready(function() {
  setTimeout(function() {
    logifySlider('W')
  }, 5)})"

uirgl <- fluidPage(
  tags$head(tags$script(HTML(JS.logify))),
  tags$head(tags$script(HTML(JS.onload))),
  titlePanel("Raup Coiling model for Mollusks"),
  sidebarLayout(
    sidebarPanel(
      sliderInput(input="W",label="Whorl Expansion Rate (W)",
                  min = 0, max = 5, value = 0.301, step = .0001),
      sliderInput(input="D",label="Umbilicus opening (D)",
                  min=0, max=0.9,value=0.3,step=0.01),
      sliderInput(input="S",label="Shape of opening (S)",
                  min=0.1, max=5,value=1,step=0.01),
      sliderInput(input="RT",label="Rate of translation (T)",
                  min=0, max=35,value=2,step=0.1),
    ),
    mainPanel(
      rglwidgetOutput("coilrgl",width=800, height=800)
    )
  )
)
shiny makes it very easy! This is the whole code to create the actual HTML page the user is going to interact with. We just define our variables while creating sliders for variable selection. I already discussed the two javascript functions before.
serverrgl <- function(input,output){
  mqd <- reactive({ #Compute the shape
    # First we need to grab the variables picked by the user
    RT <- input$RT
    D <- input$D
    res <- 20 #Resolution of a single step is fixed here
    W <- round(10^input$W,2)
    S <- input$S
    # To make the app more functional we're actually computing the number of turns instead of
    # proposing it as a variable.
    turns <- 5
    if(W<1.5 & RT>2) turns <- 10
    if(D>0.5) turns <- 10
    if(D<0.1 & RT==0) turns <- 2
    if(W>100) turns <- 1
    # We also made the number of steps a function of the number of turns:
    steps <- ifelse(turns>5,150,75)
    # Then we compute the generating shape
    circle <- make_elliptic_generating_shape(D,S,res)
    # We coil it:
    ce <- coiling(RT,W,circle,turns,steps,"dextral")
    # I am a bit ashamed of the next 3 lines, but 3D geometry is hard :)
    CE <- as.data.frame(ce)
    CE <- CE[c(2,3,1)]
    CE[,2] <- -1*CE[,2]
    # We compute the indices of the vertices
    qd <- pt2quad(steps,res)
    # And we make it a 3D mesh
    mesh3d(CE,quads=qd)
  })
  output$coilrgl <- renderRglwidget({ #Render it as 3D plot
    rgl.open(useNULL=TRUE)
    # Having the shape being computed outside this function allows the shape not to be recomputed all the time
    # (useful in the actual app in which the users modify the angle of the plot as a variable, not so much here):
    m <- mqd()
    rgl.viewpoint(zoom = 1, theta=90, phi=30)
    bg3d(color="grey80")
    material3d(color="lightsalmon",emission="black",alpha=1,specular="white",ambient="black",textype="luminance")
    shade3d(m,override=TRUE) #Apart from this line that actual plot the shape, the rest is pure aesthetic
    light3d(theta=10,phi=10)
    rglwidget() #Launch the rgl widget
  })
}

#The last line finally launch the app:
shinyApp(ui = uirgl, server = serverrgl,options=list("launch.browser"=TRUE))
And this is what happens "server-side". The retrival of the variables, the computation of the shape and its plotting, and that's it. Note the output$coilrgl: "coilrgl" is the name we gave in the previous code block to the placeholder for the rgl plot in the HTML page; and "output" is the name of the server's output... because we named it that way in the arguments of the function (see first line). Both reactive and renderRglwidget are "reactive" in that they will re-run every time they need to (i. e. when the user do something that would change their output).
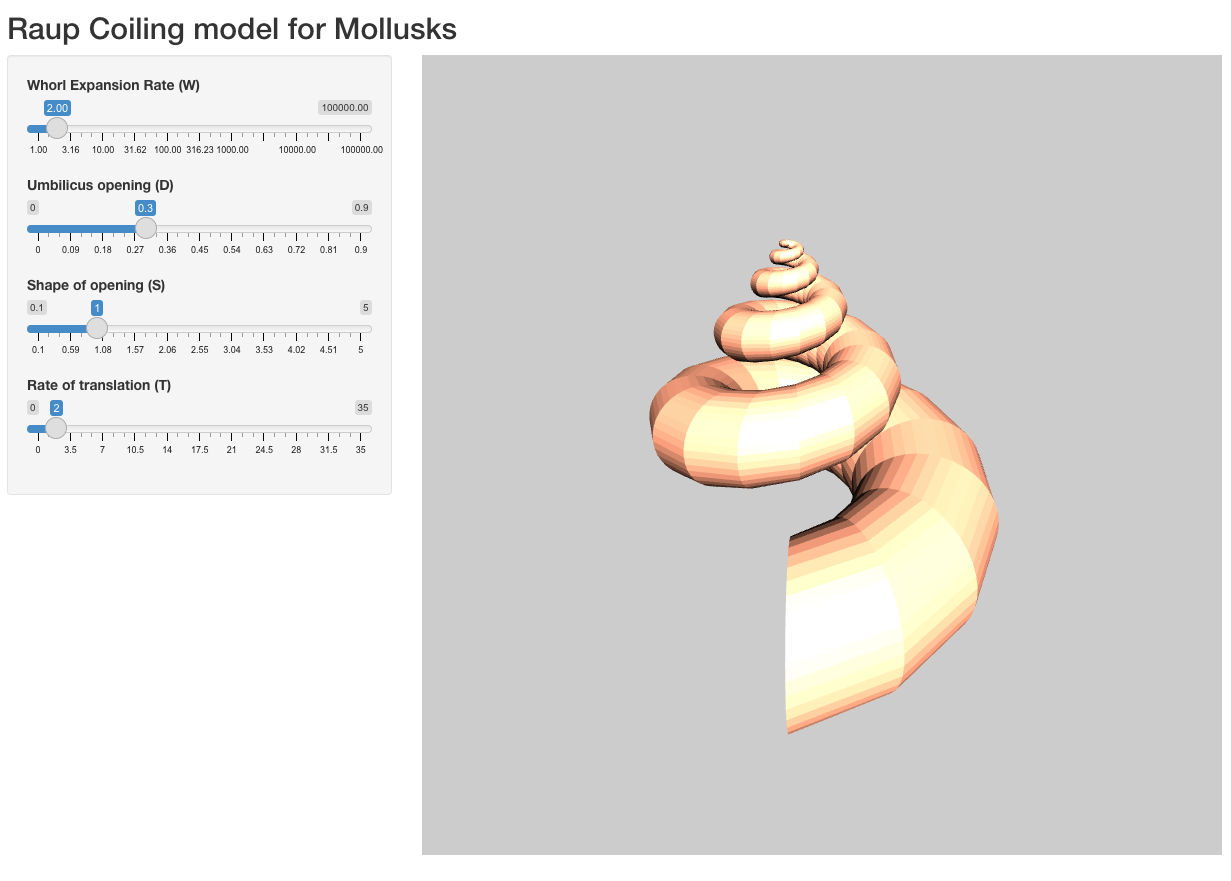
The result.